502s? 503s? oh my!

I am developer/code-reviewer/debugger/bug-fixer/architect/teacher/builder from dubai, uae
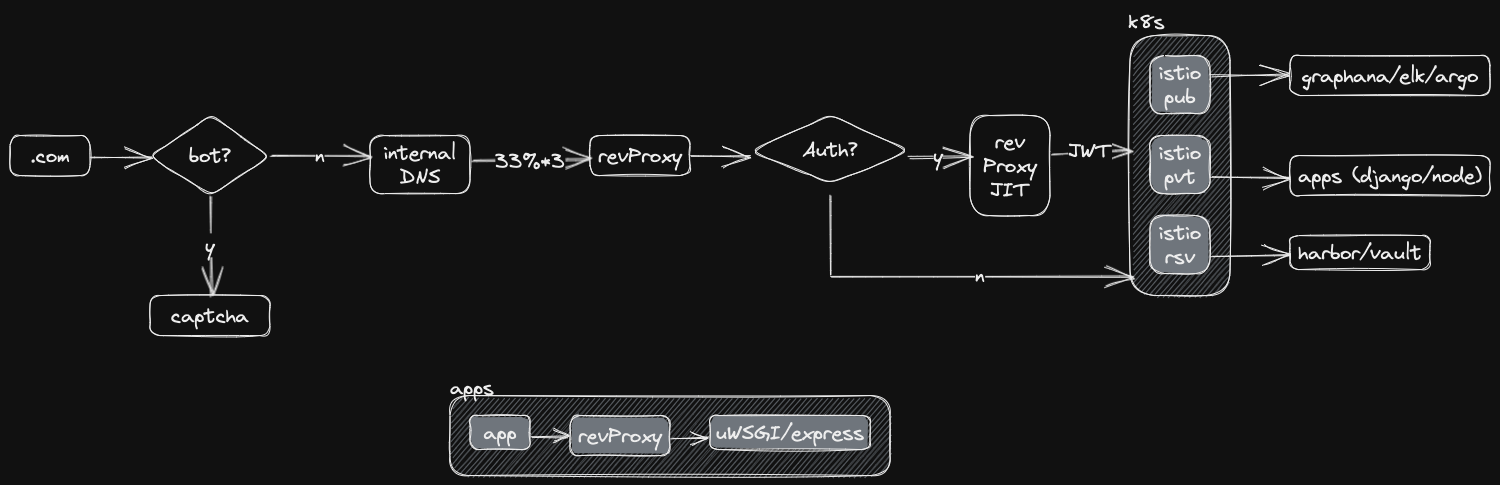
Above (via excalidraw) is our current architecture in the cloud.
When we built our dashboards to track http_status via our rev(erse)Proxies, we saw periodic spikes of 5XX errors, which were predominately 502s with a spattering of 503s.
These have to do with connectivity to and load on the apps running, where
502s, the respective revProxy's couldn't connect to any valid (upstream) apps
503s, where apps were temporarily overloaded and not available (but connectable)
502s shouldn't happen with our current elastic(based on latency thresholds) k8s application setup which is configured for HA (high availability) with a minimum of 1-2 pods per.
503s shouldn't happen because the pods were set up with generously over-provisioned CPU/Memory.
But they were.
502s
Diving deeper into the logs we noticed that the respective response would come from different proxies across the system but was consistent within applications. This helped us to group issues based on distance from the app.
Closest (apps): Within the pod, there was a few configuration issues with the applications' dependent server.
Further: Had to do with configurations of k8s
Sensitive pod scaling was dampened via
stabilizationWindowSeconds(2.1) Led to the scaling of k8s cluster nodes which implicitly caused flux in the application pods being moved within nodes. To minimize this,
maxDisruptionBudgetwas reduced from the default50%and the minimum number of pods per app where set to4
503s
(2.2) ensured that the minimum number of pods at any given time (due to node scaling) would be 2 at the expense of running a slightly under utilized cluster. This along with asymmetric up/down stabilizationWindowSeconds , help reduced this types of errors.
The powers at be are appeased, for now.